
TECHNOLOGY
Where Can I Find an Enterprise AI Company That Builds Secure Self-Hosted LLMs?


Instead of choosing the most capable model existing, manufacturers are more interested in knowing where their sensitive business data is going and who is controlling the AI environment processing the same. Some important data, including production records, engineering documents, supplier information, quality reports, and customer data, are highly confidential.
This is why many tier-2 manufacturers are exploring enterprise AI companies that can not only run LLMs locally but also deploy them securely within their existing infrastructure.
What Should You Look for in an Enterprise LLM Deployment Company?
There are a few pointers on which you should debate before employing an AI vendor for your work.
1. LLM Deployment Architecture
Your LLM deployment architecture should be designed to meet security, scalability, performance, and workload requirements. It must necessarily cater to your business needs, meaning it shouldn’t be a one-size-fits-all setup. This will further make sure that your AI environment can scale without requiring a complete rebuild.
2. On-Premises LLM Deployment
It’s no wonder to think about running an LLM within your own infrastructure. Data privacy is important, and businesses handling sensitive manufacturing or production datasets go through the tension. A capable service provider like Iconflux can provide on-premises LLM deployment, which includes servers, GPUs, networking, and internal security requirements. This gives organisations greater control over AI and its operations.
3. Enterprise Integrations
LLM becomes useful only when it is able to seamlessly integrate with your organisation’s existing systems. Your enterprise AI partner must be able to connect AI with your current ERPs, CRMs, databases, document repositories, and other business applications. What this does is allow the LLM to work prominently instead of acting like a mere chatbot.
4. Security And Governance
From address user permissions and data protection to encryption, monitoring, and audit trails, your AI provider must ensure security and governance from the start. Security and AI governance are both important parts of the enterprise AI architecture itself. This helps to ensure that employees are able to access only the information they are authorised to use.
5. Long-Term Support
Deploying an LLM isn’t enough; rather, your service provider needs to provide support for model optimisation, performance monitoring, infrastructure updates, and troubleshooting as requirements change. Not only will this keep your private AI environment secure, but also efficient and secure to scale.
How Important Is AI Governance for Self-Hosted LLMs?
When discussing self-hosted LLMs, it is important to discuss about AI governance. Why? Because when enterprises deploy private LLMs, a lot of information is scattered, AI governance enforces rules and regulations to keep sensitive information, documents, or databases private.
LLM deployment architecture must be based on governance, which includes policies that are defined to keep operations running smoothly and without disruption. This also includes defining who can access what, how outputs need to be reviewed, how model activities are monitored, and how changes are to be documented.
For tier-2 manufacturers, private AI’s merger becomes more important than any other. ERP systems, production records, supplier information, engineering documents, and quality data all need to be integrated in order to produce fast and genuine results. For example, a production employee may require access to machine manuals, whereas supplier pricing or financial information should be kept confidential.
- Access Controls: Determine who can use the AI and what data they can access.
- Data Governance: Protect sensitive business data throughout the AI workflow.
- Auditability: Maintain records of AI activity and key decisions.
- Model Monitoring: Monitor performance, security, and unexpected behaviour.
- Compliance: Align AI usage with relevant organisational and regulatory requirements.
Therefore, with the right AI governance and compliance framework, businesses can easily scale private LLM deployment with firm control, transparency, and confidence.
Build Private AI Without Losing Enterprise Control
Self-hosted AI is more than just keeping an LLM on the company’s server. It needs appropriate architecture, infrastructure, security controls, data pipelines, and enterprise integrations.
So, if you are ready to move beyond public AI tools, Iconflux can help you create a secure, scalable private AI environment tailored to your data and operational requirements.

If you have ever opened three different AI video tabs, exported a clip, re-uploaded it somewhere else, and still ended up with the wrong aspect ratio — you already know the real cost of a fragmented stack. Reeldo AI is built around a simpler question: what do you have in front of you right now, and what kind of video do you need by end of day?
The platform groups everything into two moves — create a new clip or refine one you already have — inside one browser workspace with a shared credit balance. You do not need to memorize model names on day one. You pick the tool that matches your starting material, generate, then extend or upscale if the clip is almost right but not quite delivery-ready.
Here is how each tool fits from a user perspective, and when to reach for it.
When You Are Starting From Scratch
Text to Video — you have an idea, nothing else
You know what the scene should feel like but you do not have footage, photos, or a reference clip. Write a prompt, pick an engine, and get a short clip with optional sound. This is the fastest way to test hooks for ads, openers for Reels, or mood pieces before you invest in a real shoot.
Typical users: social managers testing three ad angles in an afternoon; creators who need a cinematic intro without a camera.
Image to Video — you have a still, you need motion
You already have a product photo, a headshot, a property shot, or a design render. Upload it, describe how it should move, and Reeldo AI animates it into a vertical or horizontal clip. If you generated a visual preview elsewhere — for example, a landscape or exterior render from ai-yard-design.com — you can drop that image straight in and turn a static mockup into a walkthrough-style clip for listings or social posts.
Typical users: e-commerce teams turning packshots into TikTok ads; real estate agents and designers who have photos or renders but not video crews.
Reference Studio — you saw something trending and want your version
This is the tool most users come back to once they understand the platform. Paste a TikTok or Reels link, or upload your own images, clips, and audio, and describe what the new video should look like. Reeldo AI uses the reference for pacing and motion while you supply the subject — your product, your character, your brand.
Typical users: creators reverse-engineering viral formats; brands adapting a competitor’s ad structure with their own SKU; anyone building a consistent AI avatar across multiple episodes.
URL to Video — you have a live web page, not a script
Paste a product page, blog post, or landing page URL. The platform reads the page, suggests a creative direction, and pre-fills a clip you can generate and tweak. Useful when marketing publishes faster than video production can keep up.
Typical users: content marketers repurposing blog posts into social teasers; founders launching a new page who need a same-day video asset.
File to Video — your source material is a deck or document
Upload a PDF or PowerPoint — pitch deck, training slides, report — and generate a short narrated clip from the content. Wan handles document-to-video so you are not manually storyboarding every slide.
Typical users: startup teams summarizing investor decks for outreach; L&D teams turning internal docs into shareable explainers.
When You Already Have a Clip
Video to Video — the footage works, but something needs to change
You have a usable take but the background is wrong, the light is flat, or a distracting object needs to go. Upload the clip or paste a social link, describe the edit, and keep the original motion. Faster than reshooting when the performance or camera move is already good.
Typical users: performance marketers running background variants for A/B tests; creators fixing lighting or removing unwanted elements from an otherwise keeper clip.
Video Extend — the clip is good, just too short
The hook lands but you need a few more seconds for YouTube pre-roll or a product demo embed. Extend adds time at the end of the same shot instead of regenerating from zero. Chain a couple of passes if needed, then move on.
Typical users: anyone who nailed an 8-second bumper but the placement requires 15 seconds; demo videos that need a little more runway without a full redo.
Video Upscale — the clip is right, the resolution is not
Export or upload your clip and push it to 1080p or 4K without changing length or content. Run this after extend if you need both more seconds and a sharper master for client delivery or premium ad slots.
Typical users: agencies handing off finals to clients; teams hitting minimum resolution requirements on ad platforms.
One Workflow, Not Eight Subscriptions
What ties the tools together is that they share the same account, history, and credits. A realistic afternoon might look like this: paste a blog URL and generate a teaser (URL to Video), swap the background on a product clip you already had (Video to Video), add four seconds at the end (Video Extend), upscale to 4K (Video Upscale), download. No re-uploading between apps, no reconciling three invoices.
Reeldo AI also includes Frame Lab for the image side — generate a start frame, edit it, remove a background — then jump into Video Studio with that frame ready. For pre-viz, a quick four-frame storyboard can happen before you commit credits to full motion. Most video-first users will live in Studio; Frame Lab matters when your bottleneck is “I need a still before I can animate anything.”
Behind the scenes, the platform routes jobs to different engines (Seedance, Kling, Veo, MiniMax H3, Wan, and others) based on the mode and quality you pick. You choose by outcome — fast draft, native audio, longer duration, 4K — rather than by memorizing which model launched last month.
Who Reeldo AI Is Actually For
You will get the most value if:
- You produce short-form video regularly (social, ads, explainers) and want creation plus polish in one place
- Your inputs vary — sometimes a prompt, sometimes a photo, sometimes a TikTok link or a PDF
- You care about shipping variants (extend, upscale, background swap) without opening another tool
You may want something else if:
- Your output is long-form or broadcast-grade post-production
- You only ever need one simple text-to-video clip and nothing else
- Your work is entirely static design with no video deliverable
Bottom Line
Reeldo AI is less about owning the flashiest single model and more about covering the full path from “I have an idea / a photo / a link / a deck” to “I have a clip I can post or deliver.” Reference Studio stands out for trend-driven creators; URL and File to Video fill gaps most AI video tools skip; extend and upscale close the loop when the creative is right but the specs are not.
If you are comparing platforms this quarter, the useful test is not reading feature lists — it is running your actual starting material through the matching tool once, then seeing whether refine steps stay in the same tab. New accounts include starter credits for exactly that kind of trial.
Try it with your real workflow at Reeldo AI.

Web search is often the evidence layer beneath an AI agent’s final answer. If the agent begins with irrelevant, outdated, or weakly supported material, better prompting and reasoning will not reliably fix the result. Selecting a search provider should therefore be an evaluation project, not a branding exercise.
For example, teams choosing between Exa and Brave Search should look beyond a simple winner-and-loser comparison. The more useful question is whether each service returns the right evidence, in the right format, within the speed and budget limits of a particular agent workflow.
Why Search Quality Shapes Agent Performance
An agent may search once for a direct fact or perform several searches while planning, verifying, and refining an answer. Weak results can cause it to open unnecessary pages, repeat queries, pass more text to the language model, and still reach an unsupported conclusion. A support agent investigating a recent software error, for instance, needs up-to-date documentation or a reliable discussion of the issue, not a loosely related article with the same keywords.
That distinction is central to information retrieval: finding documents is not the same as finding evidence that answers a specific question. A useful evaluation checks whether retrieved results contain the facts an agent needs to complete its task safely and accurately.
Start With the Agent’s Main Job
Define the workload before comparing providers. A single search API may perform well for one category of questions and less well for another.
- Current-events research needs fast indexing, clear dates, and usable recency controls.
- Technical support needs strong coverage of product documentation, repositories, forums, and manuals.
- Business research needs accurate entity matching for companies, people, and market information.
- Product discovery needs current product pages, prices, availability, and reviews.
- Internal knowledge work may need to combine public web results with private files and databases.
Build a Fair Testing Set
Create a test set of 30 to 50 questions drawn from real user requests, support tickets, planned workflows, or carefully designed task simulations. Include straightforward questions, ambiguous wording, niche terminology, similar entity names, technical questions, and facts that have changed recently.
For each query, record the expected answer, the facts that must be supported, and one or more trustworthy pages likely to contain the evidence. Run every candidate with the same query wording, result count, filters, timeout rules, and downstream model settings. This prevents a provider from appearing stronger simply because it received an easier setup.
Score Retrieval Accuracy
Judges’ results by evidence value rather than keyword overlap. Ask whether the top result answers the question, whether the strongest sources appear near the top, whether the API understands the user’s intent, and whether it distinguishes similarly named people, products, companies, or places. A page can be relevant to the broad topic yet fail the test if it lacks the required date, number, version, or policy detail.
Check Freshness and Date Control
Test questions involving the past day, week, month, and year. Review whether the response includes publication dates, update dates, date ranges, or recency filters. Freshness is especially important for news, prices, regulations, software releases, schedules, public figures, and safety-related information. Also, inspect apparently new pages, since a recent page can summarize outdated material.
Evaluate Citations and Source Support
Agents should make it easy for users to inspect the basis for an answer. Check that the result URLs are stable, that titles and dates are available when possible, and that excerpts point to the relevant claim. Test conflicting sources as well. A good workflow should help the agent identify disagreements rather than quietly selecting the first convenient result.
Avoid citation theater, where an answer includes several links that do not support its most important statements. The standard is not the number of sources displayed. It is whether a reviewer can follow each important claim back to relevant, credible evidence.
Compare Latency Across the Full Workflow
Search latency is more than the time to receive a result list. Measure the initial search response, page fetching and extraction, model processing, and total time to a final answer. Record the median, 95th percentile, and worst-case times. Tail latency matters because a slow call can hold up an entire agent chain, particularly when the agent performs several searches in sequence.
Calculate the Real Cost
Request pricing is only one input. Count search calls, page extraction or browser actions, retries, failed requests, duplicate queries, and the language-model tokens created by retrieved text. Then calculate the cost of completing a successful task. A lower-priced search request can be more expensive in practice if poor ranking creates extra searches or forces the model to process large amounts of irrelevant content.
Review Content Format and Token Use
Search snippets are useful for filtering, highlighted passages can supply focused evidence, and full-page text may be necessary for detailed research. Structured fields can simplify comparison tasks, while clean Markdown can be easier for models to process than raw page markup. The goal is an appropriate context: too little leaves the agent guessing, while too much can obscure the needed evidence and increase cost.
Test Integration, Reliability, and Privacy
Review documentation, SDKs, REST support, authentication, key rotation, rate limits, error messages, timeouts, and monitoring options. An API that performs well in a demo can still be a poor production fit if failures are hard to detect or a replacement is hard to implement.
Search queries can expose customer names, product plans, internal projects, or sensitive research. Review retention terms, model-training policies, logging practices, regional options, and security controls. The risk-management mindset described in the AI Risk Management Framework is useful here: identify the information and operational risks before sending sensitive workloads to an external service.
Use a Weighted Scorecard
Assign a score from one to five for each category, then apply weights that match the agent’s purpose:
- Answer and retrieval quality, 30%: Relevance, ranking, entity accuracy, and evidence coverage.
- Freshness and source support, 20%: Dates, recency controls, excerpts, and citation fit.
- Latency and reliability, 15%: End-to-end response times, failures, and consistency.
- Total cost per task, 15%: Search, extraction, retries, and model-token expenses.
- Content format and token efficiency, 10%: Useful snippets, passages, clean text, and structured output.
- Privacy and integration, 10%: Data handling, observability, documentation, and implementation effort.
Retest After Deployment
Search indexes, websites, provider features, pricing, and model behavior can change. Save difficult production cases, investigate weak answers, add failures to the evaluation set, and rerun the scorecard after meaningful changes to providers or models. The strongest choice is the one that continues to deliver useful evidence for the real workload at an acceptable speed, risk level, and cost per correct answer.

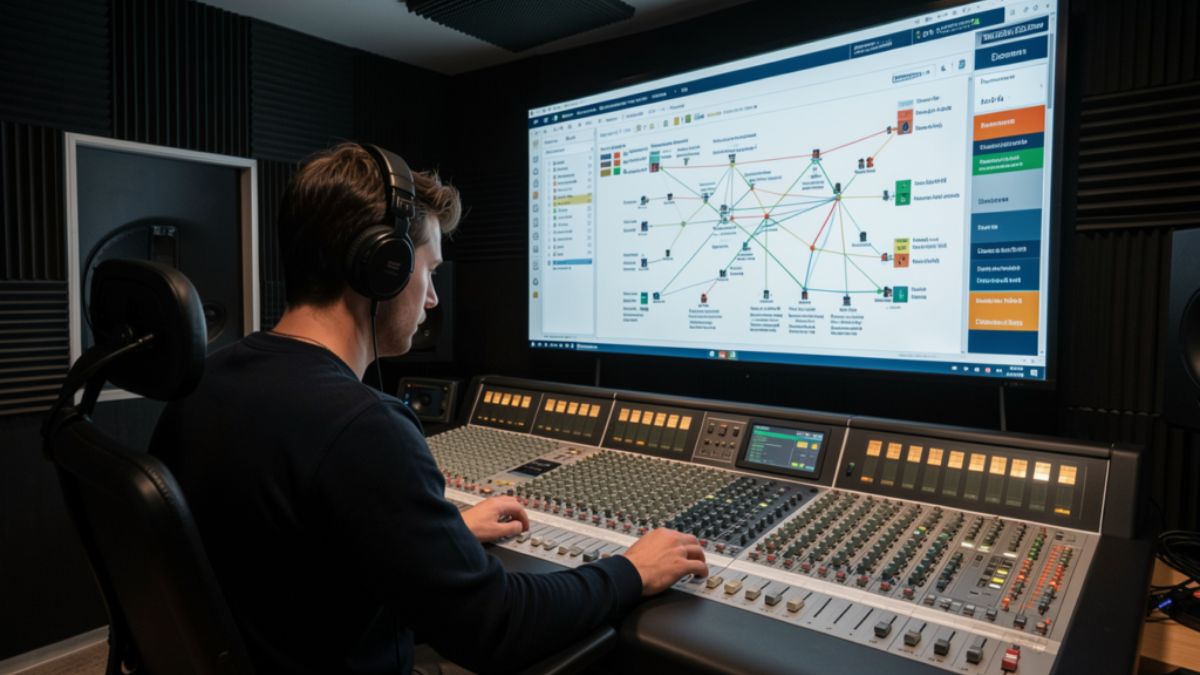
Most creators who land on backtofrontshow.com are not hunting for another download counter. They want to know who stayed through the ad read, who left at minute nine, and whether the audience they pitch to sponsors actually matches the people who press play. That gap between a play count and a real listener is where modern podcast analytics either earns its fee or wastes it.
This guide walks through what the site positions itself as, which metrics matter, how a tracking layer usually sits on top of your host, and where teams waste money. You will also get a practical checklist you can use even if you never buy a premium plan.
What BacktoFrontShow.com Is Built to Do
Backtofrontshow.com presents itself as a podcast analytics platform for hosts, networks, and media teams. The pitch is listener behavior, not vanity totals. Instead of stopping at downloads, the product language centers on demographics, listening patterns, engagement, device mix, geography, and custom reports.
That framing matches a real industry problem. Host dashboards often report downloads and unique listeners. Sponsors, though, ask harder questions. They want age bands, cities, completion, and proof that a mid-roll was heard. A platform that claims to close that gap has to show method, sample size, and limits, not just a polished map.
A short definition you can use
Podcast audience analytics is the practice of measuring how people consume episodes after the file starts. It covers who listens, how long they stay, where they drop off, which device they use, and which episodes earn repeat attention. Downloads only confirm that a file was requested.
How the name gets mixed up
Search results for the brand are messy. An older web-industry podcast, The Back to Front Show, used the same name for years. Separate sites have also used similar branding for business content. The current .com property markets analytics tools and is not the same thing as that earlier show. If you are evaluating the product, judge the dashboard, the data method, and the contract, not the old podcast archive.
How Listener Analytics on BacktoFrontShow.com Usually Works
Platforms in this category rarely replace your host. You keep publishing on Buzzsprout, Libsyn, Spotify for Podcasters, or a private RSS setup. You then add a measurement layer, often an analytics prefix or a tracking redirect on the enclosure URL. When a player requests the episode, the layer records the request and, where the player allows it, progress signals.
The flow is simple on paper.
- Connect the show by RSS or a host integration.
- Confirm the tracking prefix is live on new episodes.
- Wait for a full publishing cycle so the sample is not one lucky week.
- Read demographics, devices, geography, and episode curves.
- Export a report your sales or editorial team can actually use.
Treat the first two weeks as calibration. A launch spike, a playlist add, or a bad embed can distort early charts. Decisions get cleaner after three or four episodes under the same setup.
Metrics worth watching first
| Metric | What it tells you | What to do with it |
|---|---|---|
| Listen-through rate | Share of starters who reach the end, or a set minute mark | Cut or move sections where most people leave |
| Drop-off point | The minute attention collapses | Test a shorter intro or an earlier payoff |
| Unique listeners vs downloads | How many people sit behind the request count | Use uniques in sponsor conversations |
| Device mix | Phone, desktop, smart speaker, in-car | Match ad length and CTA to the dominant context |
| Geography | Countries and cities with real listening | Localize offers, guests, and ad inventory |
| Return listen rate | Share of people who come back next episode | Judge series hooks, not one viral clip |
If a report cannot explain how a demographic was inferred, do not put that number in a media kit. Age and interest estimates are models. Location from IP data is stronger, but VPNs and shared networks still blur city-level claims.
Features That Change Editorial Decisions
A useful stack does more than redraw the same host chart. The feature set described around backtofrontshow.com clusters into a few jobs.
Audience demographics cover age range, location, and interests so you can brief guests and sponsors with something sharper than “people who like podcasts.” Listening behavior covers session length and patterns across the week. Engagement tracking watches likes, shares, and comments where those signals exist. Device analytics shows whether you are an in-car show or a desktop deep-dive. Geographical views turn a country list into a map your partnerships team can scan. Custom reports let you send a client a one-page view instead of a raw export.
A working weekly ritual
Pick one episode and one question. Example: “Did the new cold open keep people past minute three?” Compare that episode with the prior four. If the curve improves and the topic is similar, keep the open. If the curve is flat, the topic was the driver, not the edit.
Then check devices. A show that is 70 percent mobile should not hide the offer behind a long URL spoken once. Say the offer, repeat the short link, and put it in the show notes at the top.
Who Should Pay for This Level of Insight
Not every show needs a heavy analytics layer. A hobby interview with 200 downloads a month will learn more from listener emails than from a premium dashboard. The spend starts to make sense when the number changes a decision that already has a dollar value.
| Team type | Signal you already have | When a deeper platform pays off |
|---|---|---|
| Solo host | Downloads and a few reviews | After you sell even one recurring sponsor |
| Small network | Per-show host stats that do not match | When you need one report format across shows |
| Brand studio | Campaign flight dates and vanity totals | When you must prove mid-roll delivery |
| Agency | Client asks you cannot answer from the host | When reporting time exceeds the tool cost |
Run the math in plain language. If a plan costs more than the sponsorship revenue it helps you win or protect, it is a research toy. If it shortens a sales cycle or saves a renewal, the fee can be rational. Public pricing chatter around this category varies widely, including high monthly tiers on some plan pages. Confirm the live price, the minimum term, and what happens to historical data if you cancel.
Pros and Cons
Strengths show up when the team already publishes on a schedule and has someone who will read the charts.
Pros:
- Behavior data beats download totals in sponsor calls.
- Geography and device mix improve offer design.
- Custom reports reduce the Sunday-night spreadsheet scramble.
- A prefix-style setup can leave your host in place.
- Episode curves give editors a concrete cut list.
Cons:
- Premium plans can cost more than a young show earns.
- Demographic fields are estimates, and bad decks overclaim them.
- Prefix tracking can break if a host or app strips it.
- Early data lies during launches and cross-promos.
- Another login dies if nobody owns the weekly review.
Common Mistakes
Creators repeat the same five errors.
They paste model-based age splits into a media kit as if they were a census. They judge an episode on day-one downloads and ignore the 30-day curve. They change the intro, the thumbnail, and the publish time in the same week, then credit the wrong change. They never check whether the prefix is still on the enclosure after a host migration. They buy the suite, then keep making topics from gut feel.
Another quiet mistake is comparing shows with different lengths. A 12-minute news brief and a 70-minute interview should not share one completion target. Set a benchmark inside the same format.
Best Practices for Using the Data
Treat the dashboard as an editor, not a boss.
- Freeze one variable per experiment. Change the hook or the length, not both.
- Read curves at the same age of episode, such as day 7 and day 28.
- Pair quantitative dips with qualitative notes from listener mail.
- Build a one-page sponsor snapshot: uniques, top countries, average consumption, and device mix.
- Reconcile host downloads with the analytics tool once a month so you trust the gap.
- Archive exports. If you switch tools, you will want the history.
A simple decision framework
| Question | If the answer is yes | If the answer is no |
|---|---|---|
| Do sponsors ask for proof beyond downloads? | Prioritize behavior and geography reports | Stay on the host dashboard for now |
| Can you review charts every week? | Assign an owner and a 20-minute slot | Do not add another unused login |
| Is the tracking prefix stable after publish? | Scale tests across the next four episodes | Fix measurement before you change the show |
| Do estimates match what listeners tell you? | Use demographics as directional color | Label them as modeled and keep claims soft |
How Teams Turn Charts into Better Episodes
Picture a B2B interview show. The curve falls at minute 11, right as the host finishes a long bio. The next four episodes open with the guest’s sharpest claim, then the bio. Average consumption rises by a few minutes. Nothing else changed. That is the whole point of the stack.
A narrative show might see strong completion on phones after 9 p.m. and weak completion on desktop at lunch. The team cuts a tighter chapter and moves the story payoff forward. Sponsorship inventory shifts toward the evening flight, where people actually hear the read.
None of this requires a new brand voice. It requires one person who will look at the curve before the next record date.
What to Verify Before You Commit
Ask for a sample report from a show of similar size. Ask how location and age are produced. Ask whether smart-speaker and locked-down apps undercount progress. Ask about data retention, user seats, and export formats. Ask what the onboarding does to your existing RSS. A clear answer on method is worth more than a rounded satisfaction claim on a marketing page.
If the fit is poor, you still leave with a better measurement habit. Host-level unique listeners, completion where your app provides it, and a simple listener survey will carry a small show a long way.
Conclusion
Backtofrontshow.com sits in a crowded promise: show the listener, not just the download. That promise is worth chasing once a show sells attention or reports to a client. It is not a shortcut to growth by itself. The teams that get value connect the feed cleanly, wait for a real sample, and change one thing at a time. Use the curves to edit. Use geography and devices to shape offers. Keep modeled demographics in their place. Do that, and the dashboard becomes a production tool instead of another tab you forget to open.
FAQs
What is backtofrontshow.com?
It is a website that markets a podcast analytics platform focused on listener demographics, behavior, devices, geography, and custom reports, rather than downloads alone.
Does the platform replace a podcast host?
No. Tools in this category typically sit on top of your current host through an integration or an analytics prefix on the episode file.
How is this different from the older Back to Front Show podcast?
The older show was a web-industry podcast. The current .com property promotes analytics software. They share a name, not a product.
Which metric should a new user watch first?
Start with drop-off points and listen-through rate. Those two numbers tell you whether the episode structure is working before you worry about finer demographic splits.
When is a premium analytics plan worth the cost?
It is worth it when sponsor sales, client reporting, or network rollups already depend on proof you cannot get from a basic host dashboard, and someone on the team will review the data every week.
-

 NEWS1 year ago
Historical Churches in Manila
-

 TOPIC3 months ago
Unveiling AvTub: Your Ultimate Guide to the Best AV Content
-

 TOPIC1 year ago
Symbols of Hope: The 15th Belenismo sa Tarlac
-

 TOPIC1 year ago
RIZAL at 160: a Filipino Feat in Britain
-

 TOPIC1 year ago
Simbang Gabi and Kakanin
-

 TOPIC2 months ago
Understanding Fascisterne: Origins and Ideological Roots
-

 TOPIC1 year ago
“The Journey Beyond Fashion” – Ditta Sandico
-

 NEWS4 months ago
What Caused Delta Flight DL275 to Diverted LAX? A Detailed Breakdown